Collect more data with digital assessment
DigiDiag Testsystem
Psychological Assessment Software
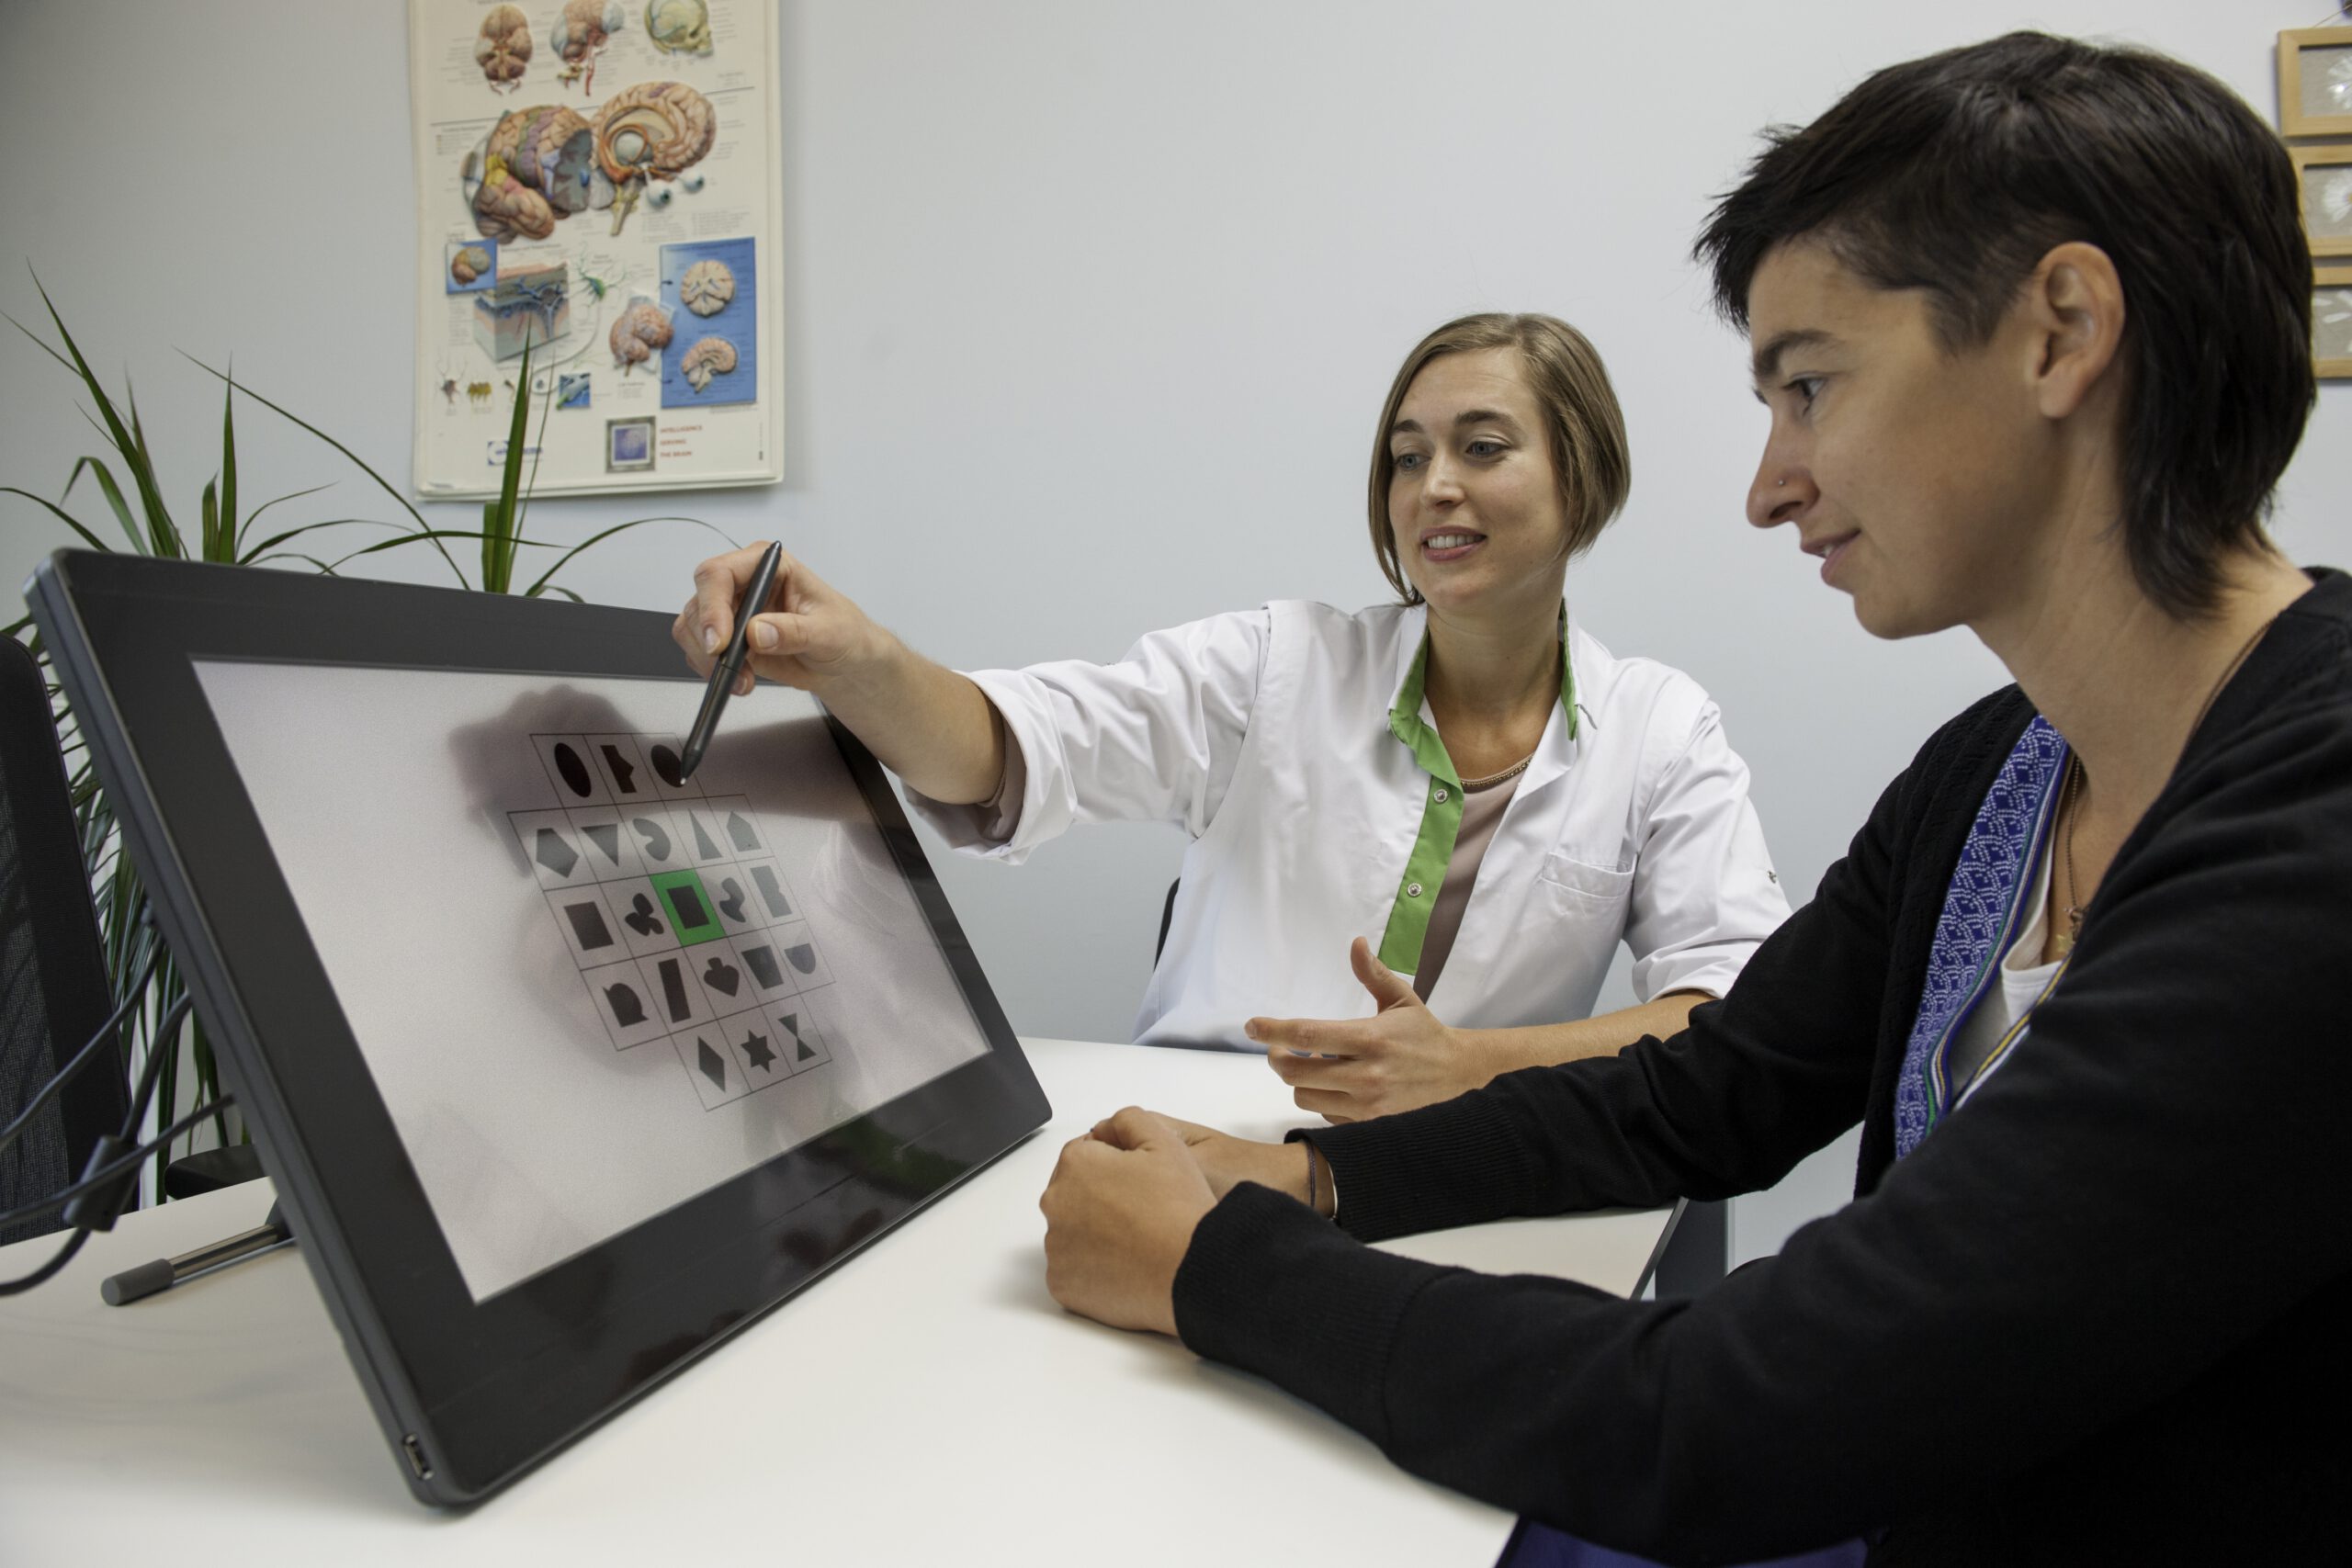
The DigiDiag software natively supports Wacom Pen and Touch Tablets. Many of our tests are designed to resemble pencil and paper tests.
This way, traditional tests can be used in a natural, however digital environment. Patients will be using an intuitive pen to respond to the tests. In the background, the software processes every single response automatically. Reports, including the drawings, graphs and normed results, are created with a few clicks only. Data can also be exported to PDF for clinical usage, or to CSV for scientific processing in SPSS, Excel or Matlab.
Furthermore, it is possible to replay the drawings as a film. Because responses and reaction times are automatically stored, more time remains to observe the patient during the test.
Advantages of DigiDiag Testsystem
Accurate, automatic timing of responses
Generate reports in your own corporate identity
Automatic scoring reporting
Sound can be recorded during the test and replayed later
A completely digital archive
Generate spreadsheet reports for scientific usage
Include remarks and comments, such as observations
Invite clients for questionnaires by e-mail
Automatic reminders for memory test recalls
Create own diagnostic tests, experimens or training tasks
Digital paper & pencil
- Intuitive usage for young and old thanks to the digital pen tablet
- Existing norms applicable and additional new norms available
- Acquires the complete process
- Digital copies available for the electronic patient dossier (EPD)
- Drawings can be replayed as a movie
- New options for more dynamic tests and measurements
- Connect measurement devices e.g. the Tobii Eye Tracker
- Real-time analysis and one-click reporting
Evidence based and clinically tested
- Metrisquare is a platform for co-creation and collaboration
- Partnerships with top-level researchers and institutions
- The perfect combination of technicians and neuropsychologists
- Long-lasting and reliable: proven technology of high quality
Cost effective and efficient
- Only pay for the instruments you need
- Save time on preparations, marking and reporting
- Significantly more effective: focus on the patient
How does it work?
Protected by password
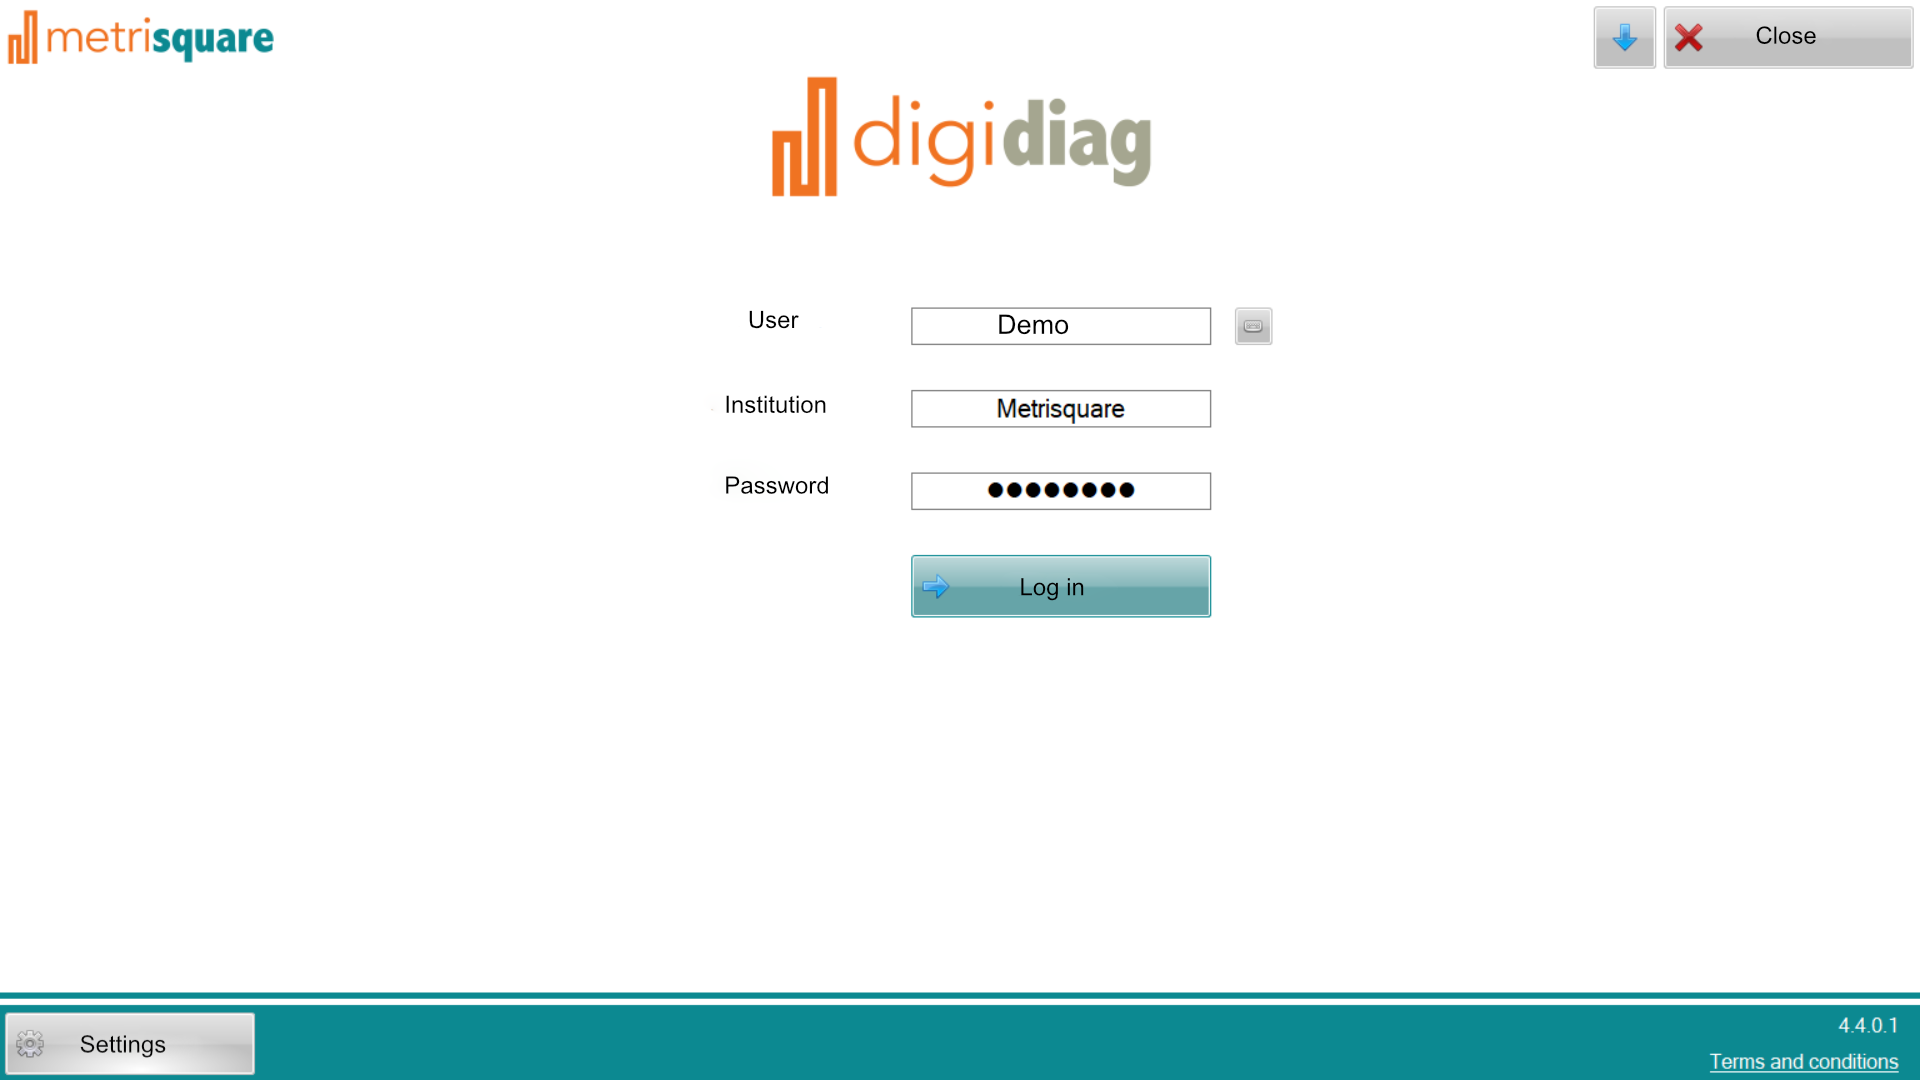
The DigiDiag testsystem is protected by a username and password, which can be entered in the login screen shown in the picture right.
Main screen
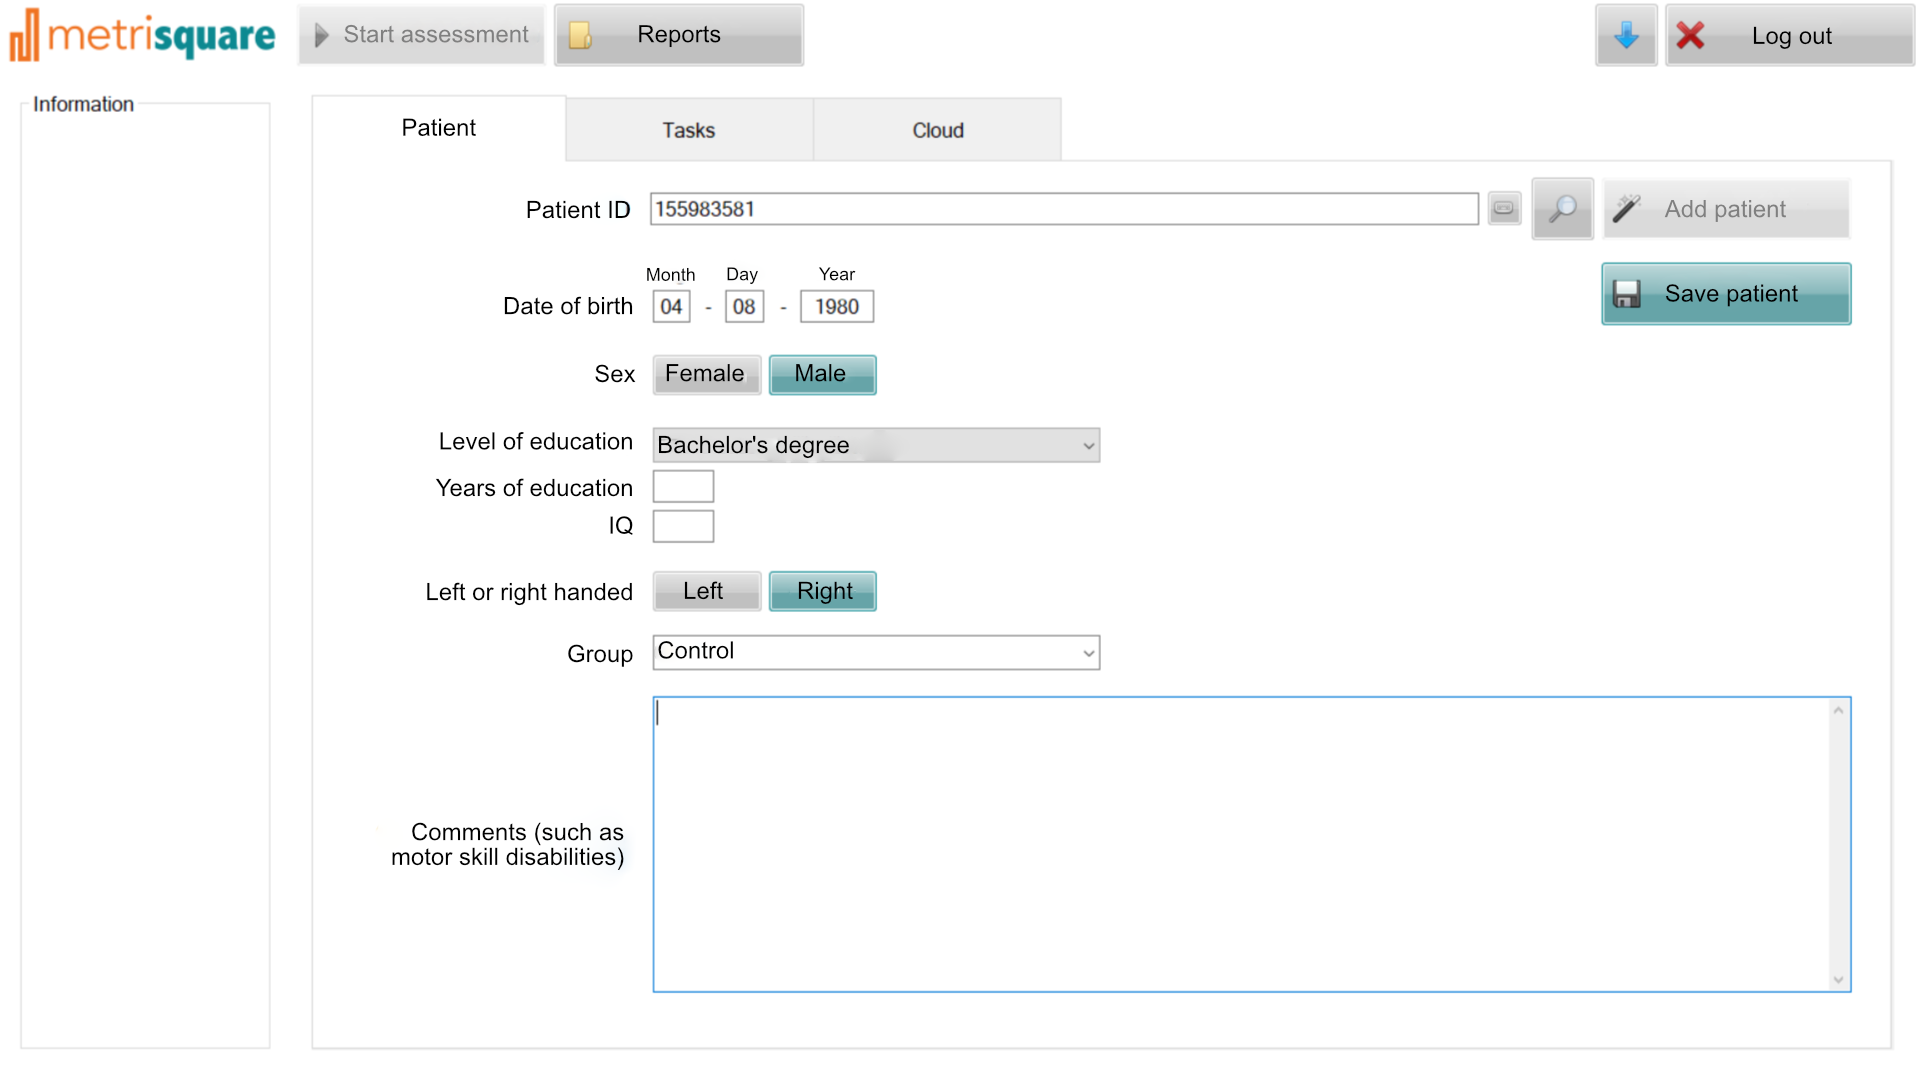
After logging in, the main screen is shown, where the patient can be selected, as shown in the image below. In case the date of birth, education and sex are entered, the DigiDiag testsystem can automatically compare measurements to norms.
However, it is also possible to test using a patient ID or anonymous code only. Comments can be entered, which will automatically be included in reports afterwards.
Selecting tests
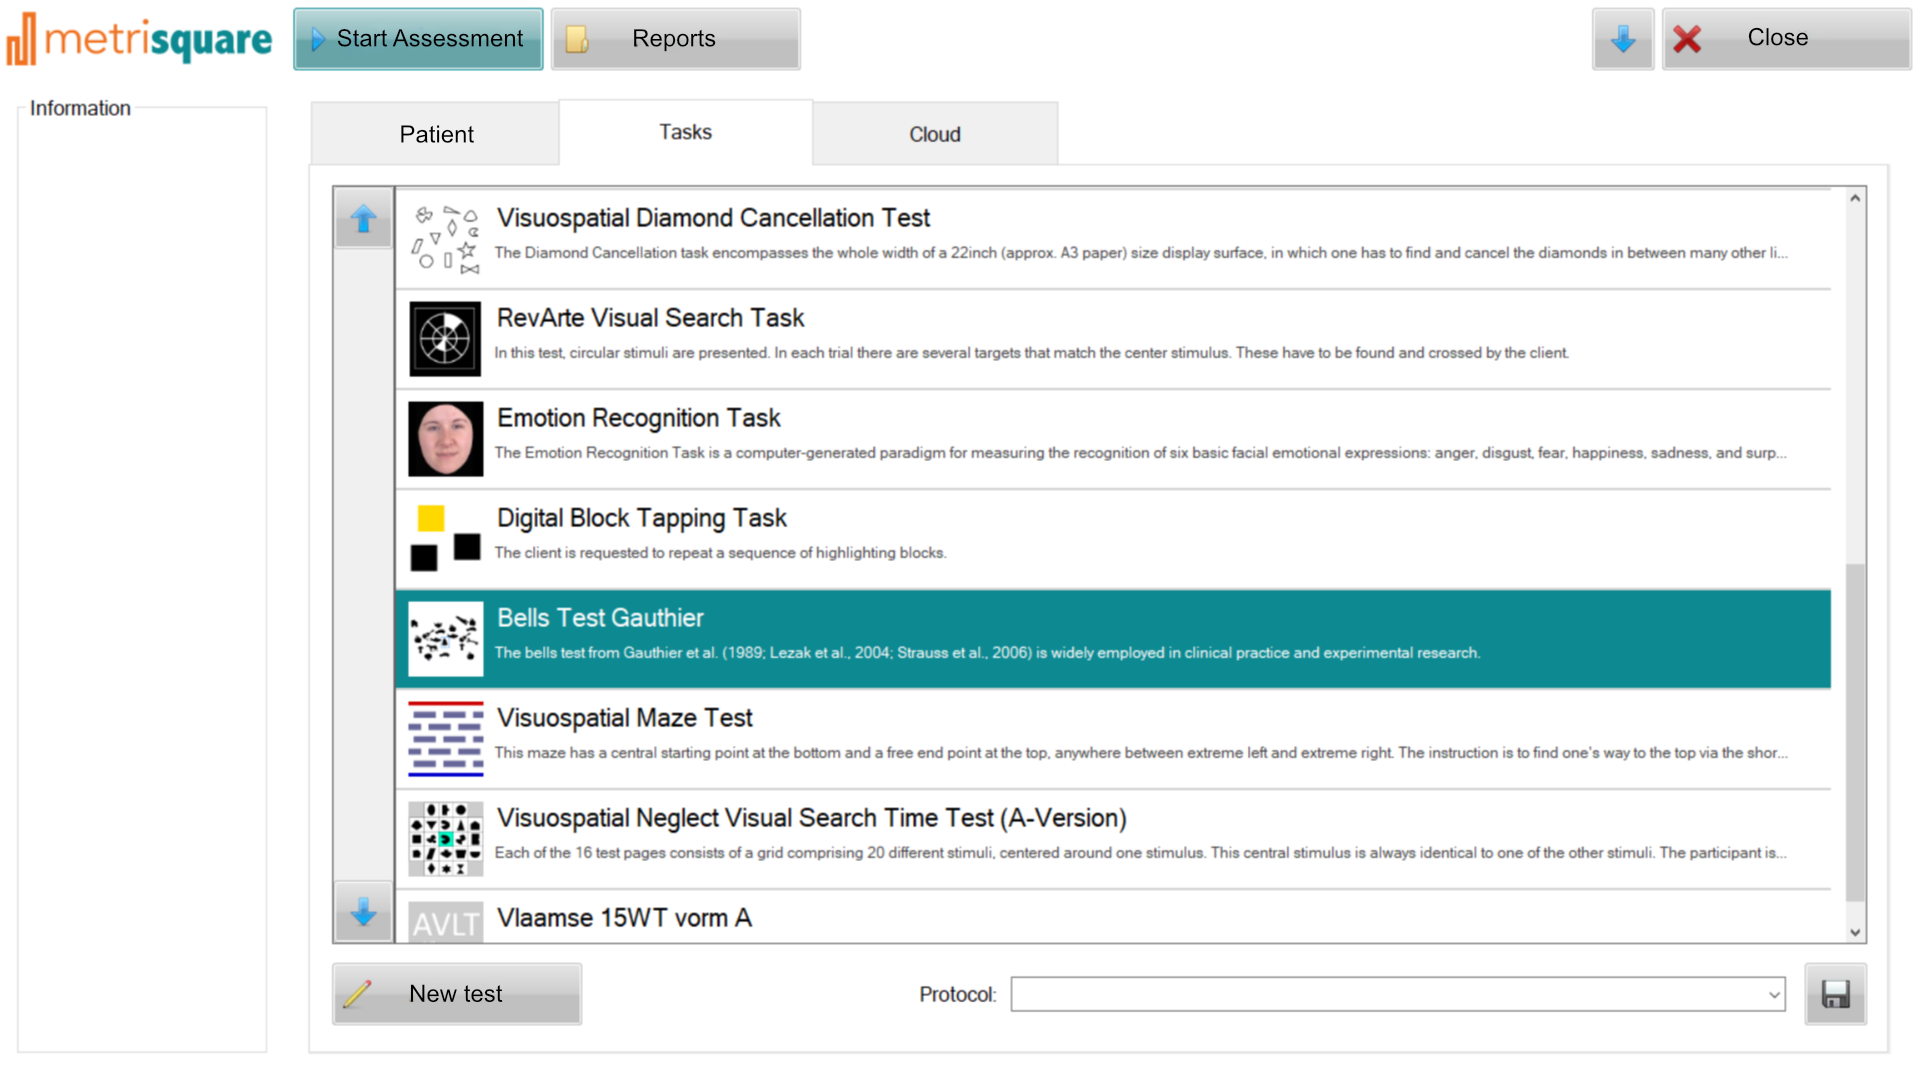
On the Tasks tab in the main screen, the tests or training tasks can be selected. By ticking a test, it will be queued for an assessment session.
On the right side, the properties of the test are shown, e.g. who published the test, how long it will take to complete, the application of the test and the rating by you and other users. In case the same set of tests is used regularly, the selected tests can be stored as a test protocol, e.g. for Dementia, Parkinson’s Disease, Visual Neglect etc.
Assessment
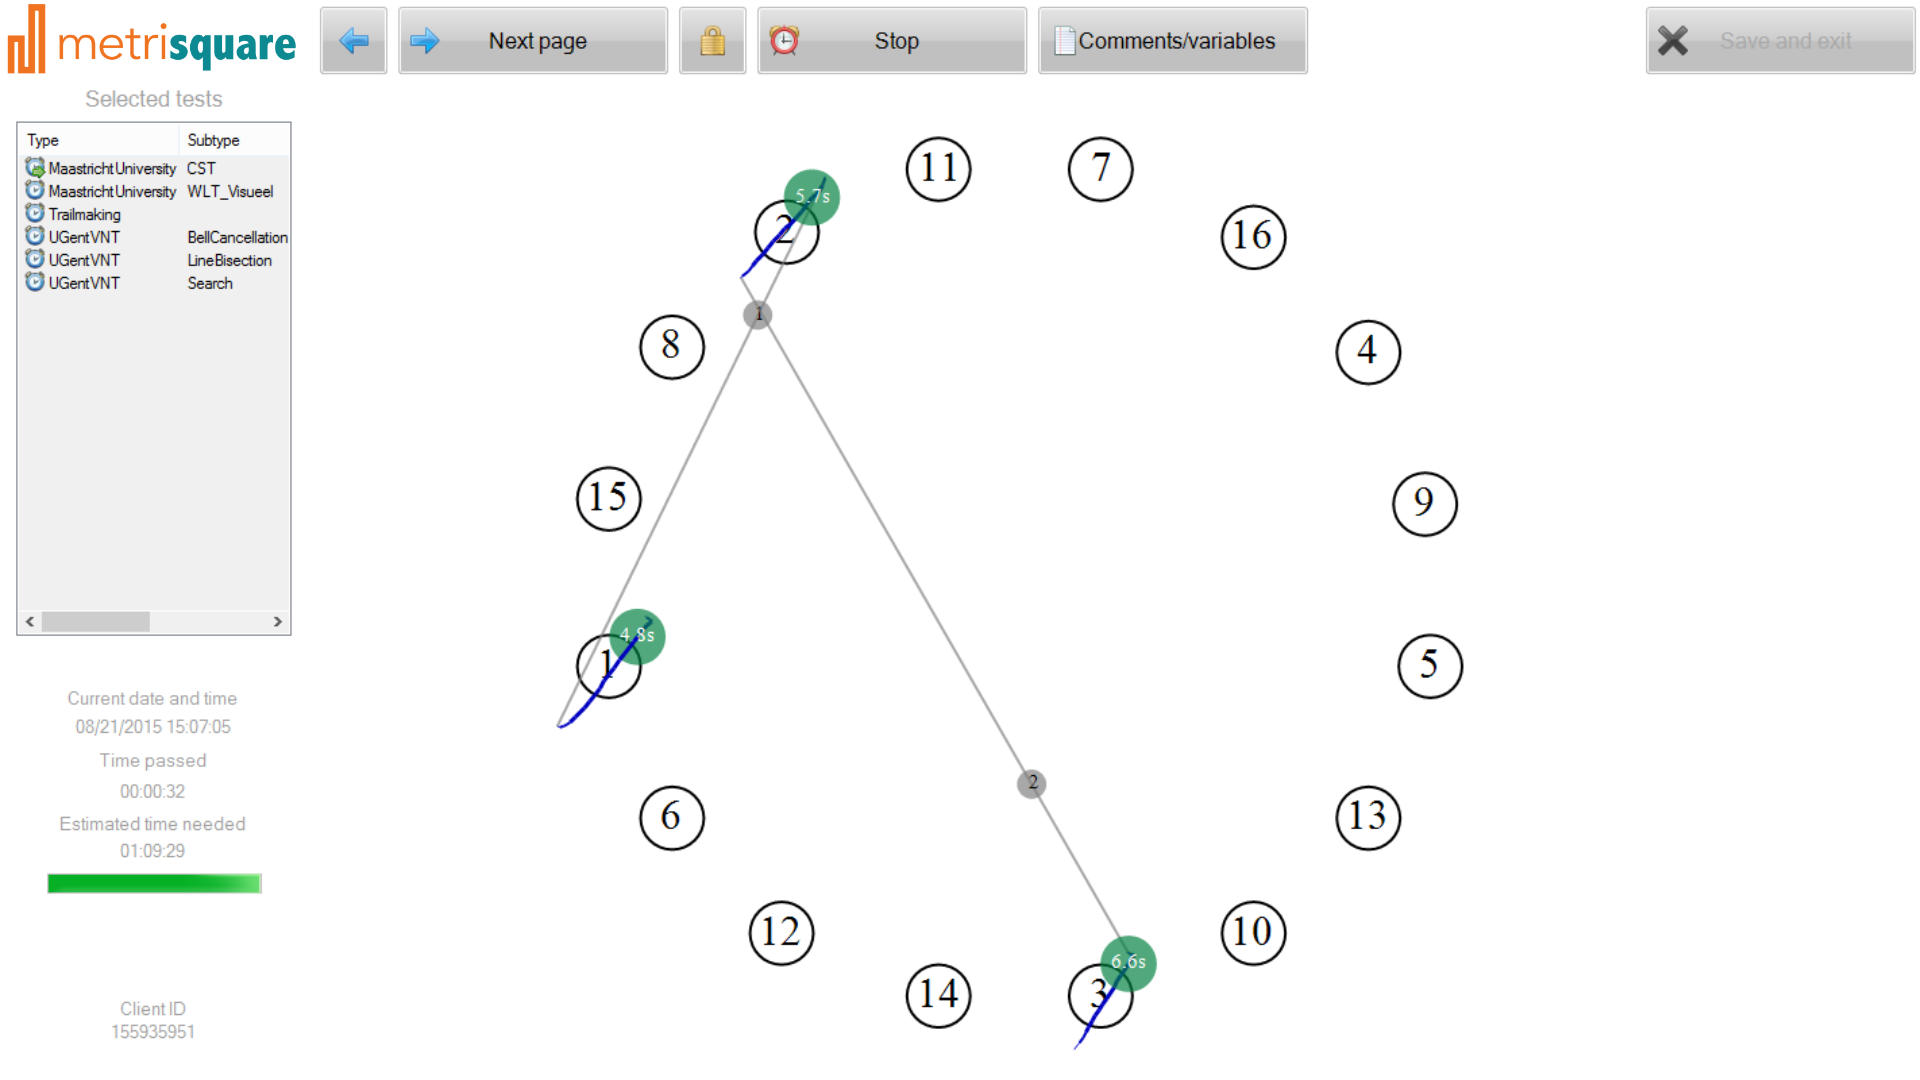
When the test session is started, the Test manager will be shown on the left. It indicates the list of tests queued for the current, as well as information on the current time and the time needed to complete the tests. On the top, a menu bar is shown which can be used to control the test.
Many of the Metrisquare tests can be compared to an interactive Powerpoint presentation, constructed of pages (slides). In case the system is used in a dual screen mode, only the test leader will see the controls and test manager, while the client sees the test only, full screen.
Automatically generated reports
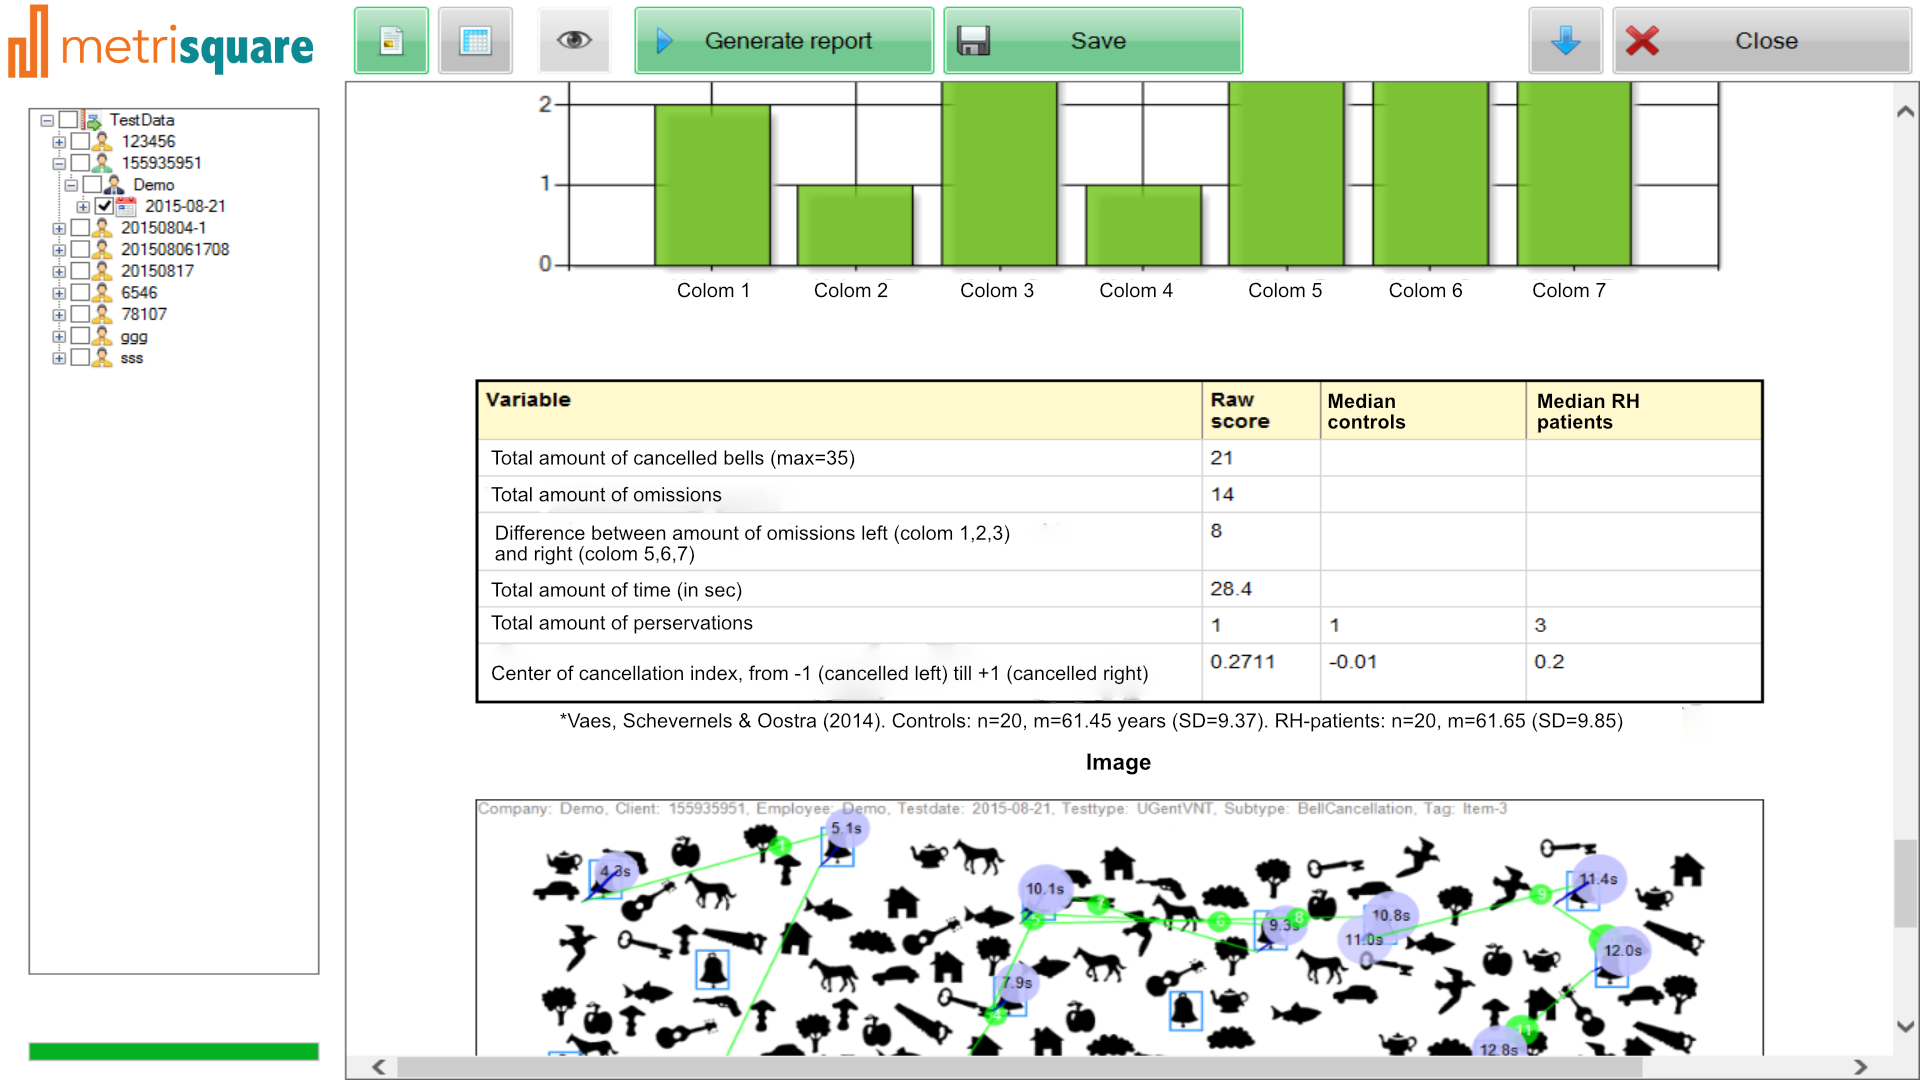
The final step is to generate a report. This is where a lot of time is saved again: the DiagnoseIS software will automatically score all data and generate a report including images, graphs and tables. The report can be saved as a PDF document, or exported to CSV for further processing in SPSS or Excel.

